Interactive Investor Reporting
From Static PDFs
to Living Reports
Interactive digital reporting for Nasdaq Helsinki's leading companies
Tap to browse reports
The core insight
Your annual report is the primary interface between your strategy and global capital markets
Static Data Silos
Financials, ESG, and strategy trapped in separate sections with no cross-referencing.
Zero Engagement Metrics
No idea which sections investors read, how long they spend, or what they skip.
The Search Burden
Investors waste hours digging through hundreds of pages of dense text.
Compliance Over Narrative
Reports designed for regulators, not the capital allocators who drive valuation.
Same data. Completely different investor experience.
Try it — switch languages, click tabs, hover for tooltips. This is what your investors see.
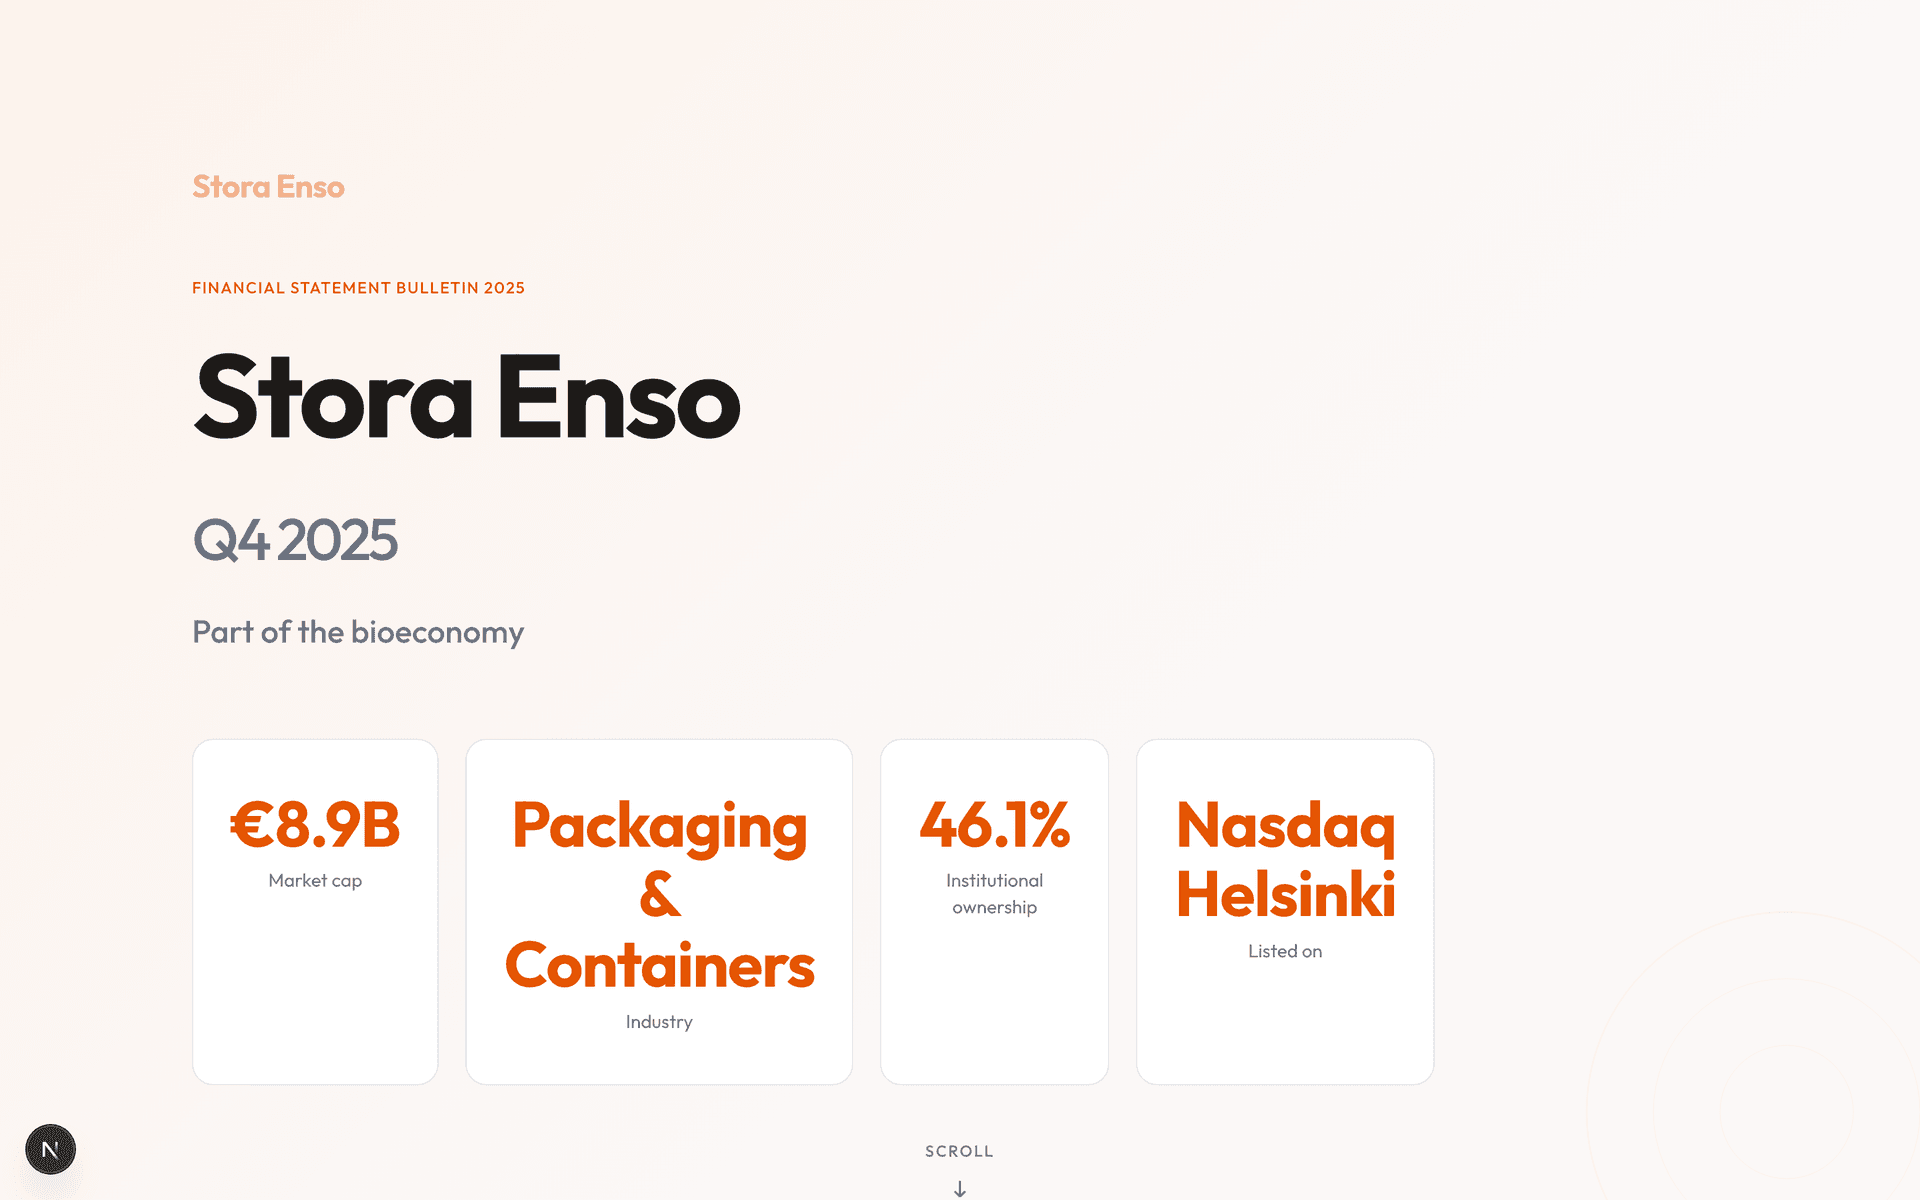
Annual Report 2025
| Metric | 2025 | 2024 |
|---|---|---|
| Revenue | 11,234 | 10,951 |
| Operating profit | 1,567 | 1,489 |
| Net income | 1,203 | 1,145 |
Live report elements
Every report uses the client's actual brand identity. Stat cards, data tables, expandable sections — no generic templates.
| Metric | FY 2025 | YoY |
|---|---|---|
| Net interest | €5.2B | +4.1% |
| ROE | 16.1% | +0.8pp |
| CET1 | 17.4% | +0.3pp |
Why CalmWorks
We bridge the gap between Strategy and Design to create clarity.
Strategy
Business Design
Translating complex business models into clear equity stories that resonate with capital markets.
Experience
Service Design
Optimizing the digital investor interface for engagement, clarity, and decision-making.
Alignment
Org Design
Mapping internal workflows across finance, communications, and sustainability teams.
How it works
Delivered in 8 weeks.
Audit
We analyze your current reporting landscape, identify gaps, and benchmark against best practices.
Co-Create
Collaborative workshops with your IR, finance, and communications teams to shape the narrative.
Launch
We build, test, and deploy your interactive report with full stakeholder training.
Evolve
Complete handoff with documentation, analytics setup, and a roadmap for continuous improvement.
What you get
Beyond a document. A Capital Market Experience Platform.
Strategic Assets
- Investor Clarity Engine
- Humanizing Leadership Video
- CSRD-Ready ESG Framework
Digital Interfaces
- Interactive Equity Story
- Real-Time Data Dashboard
- Mobile-First Investor Portal
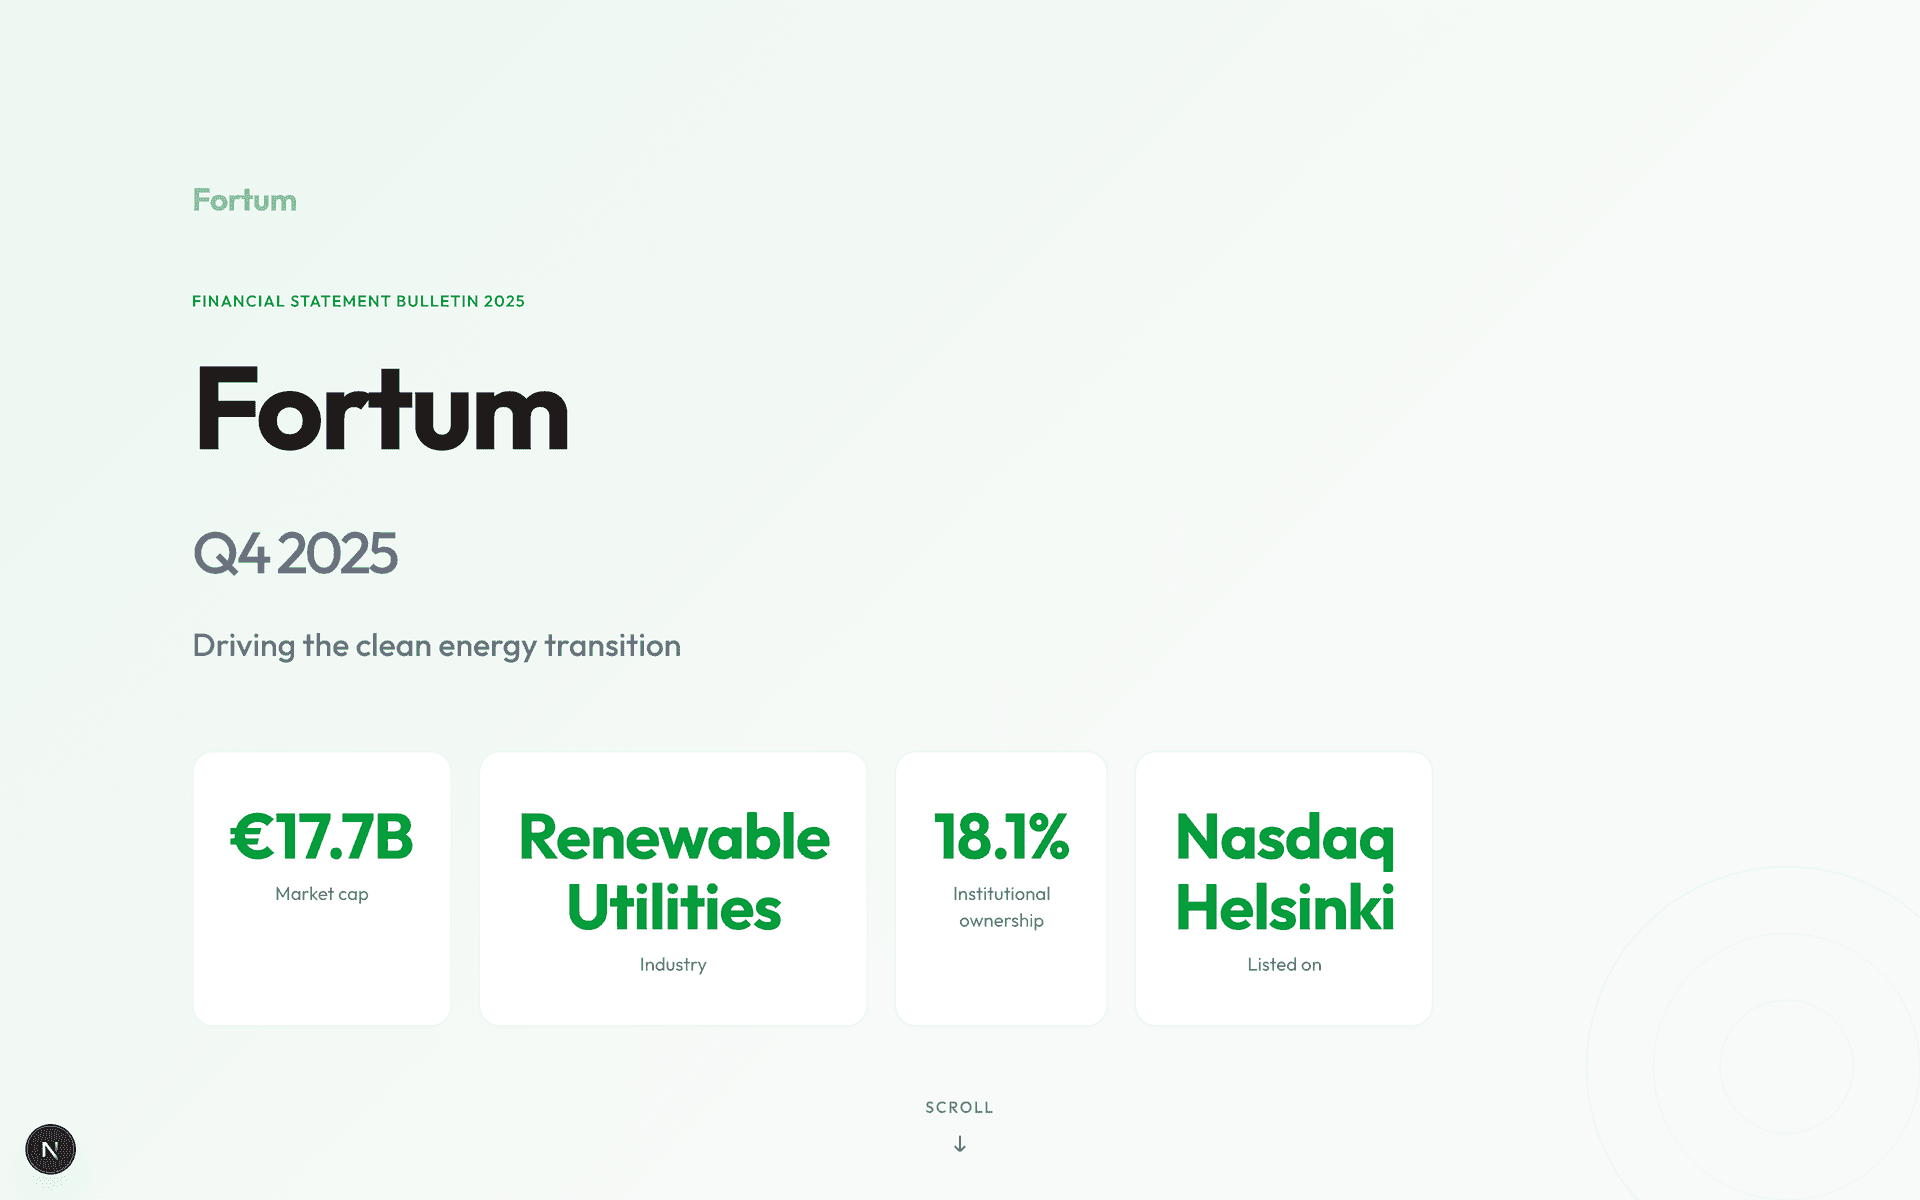
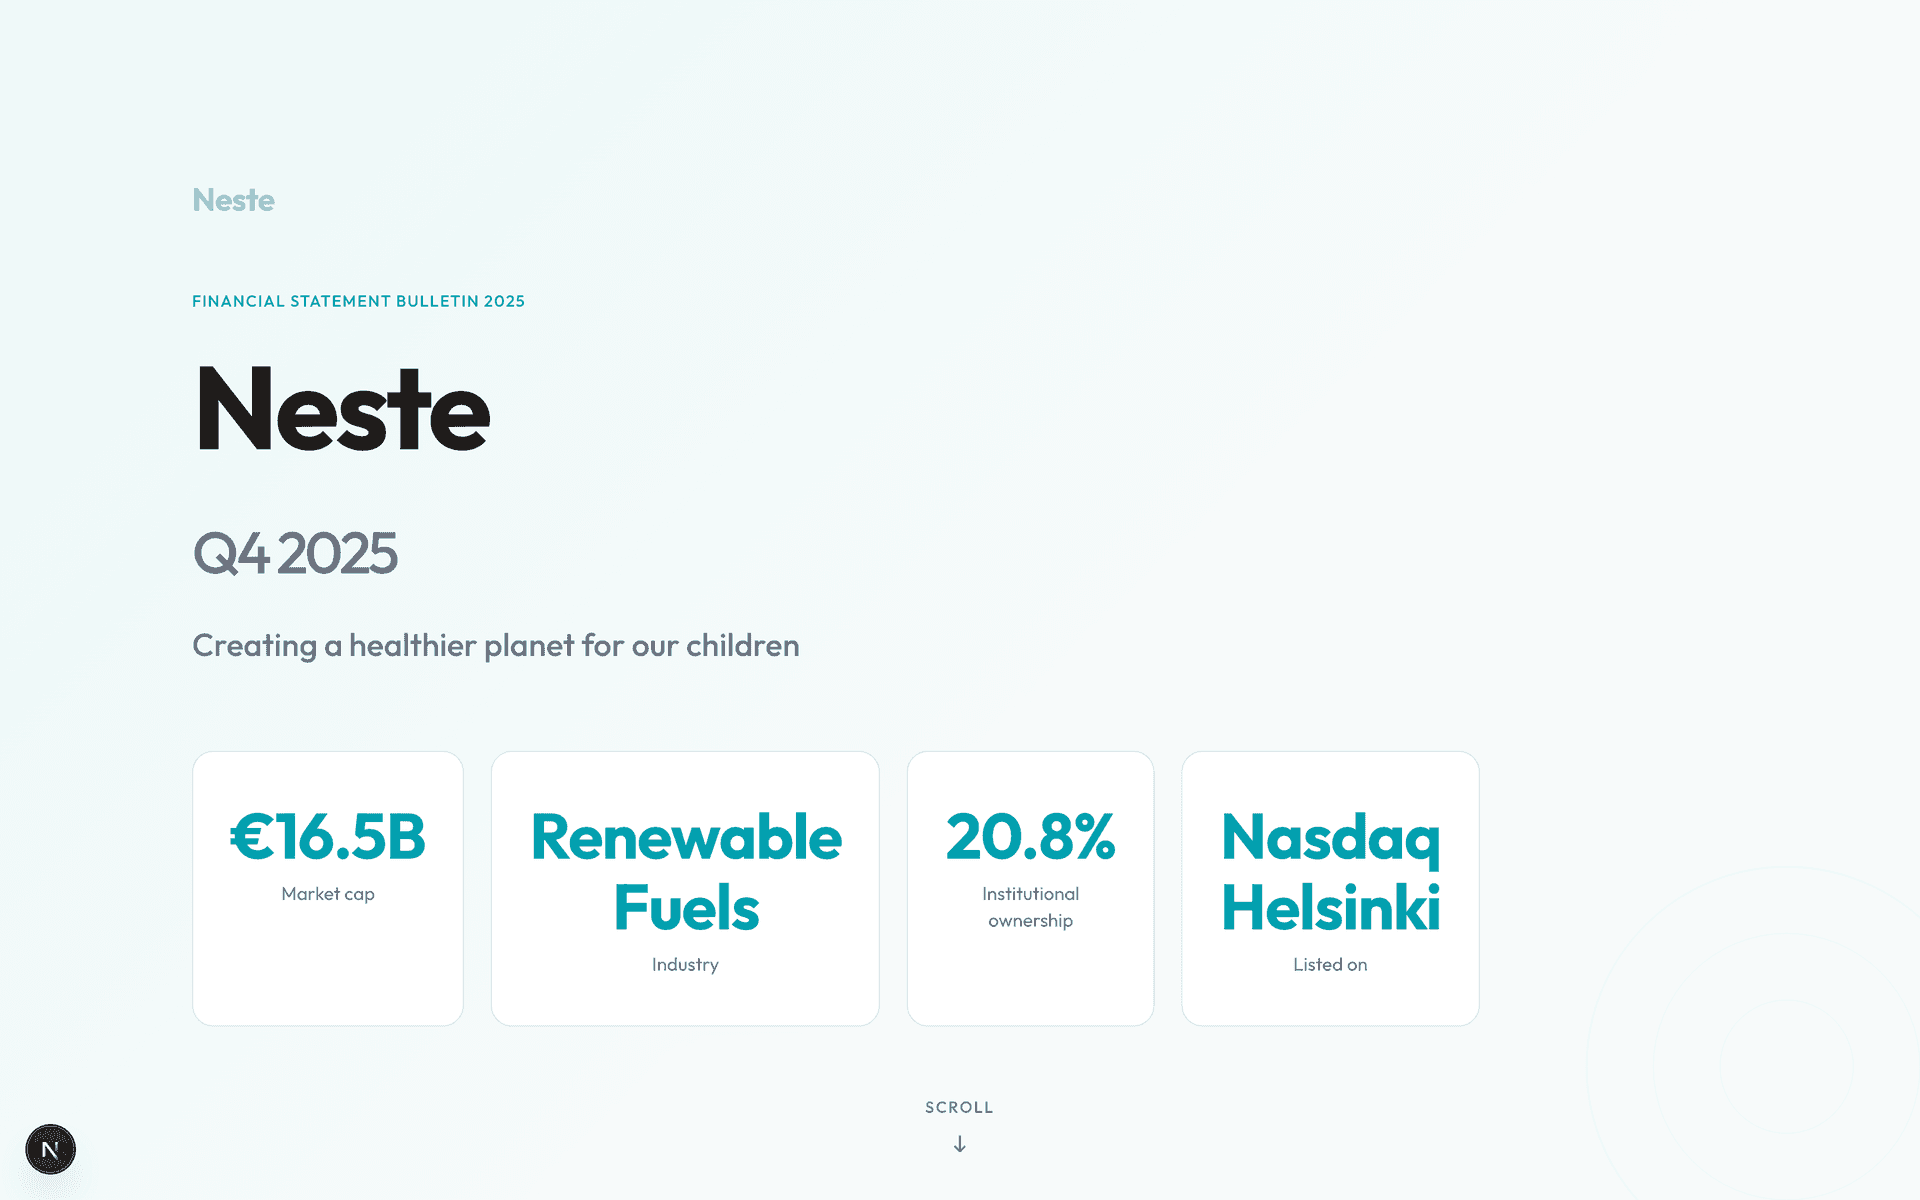
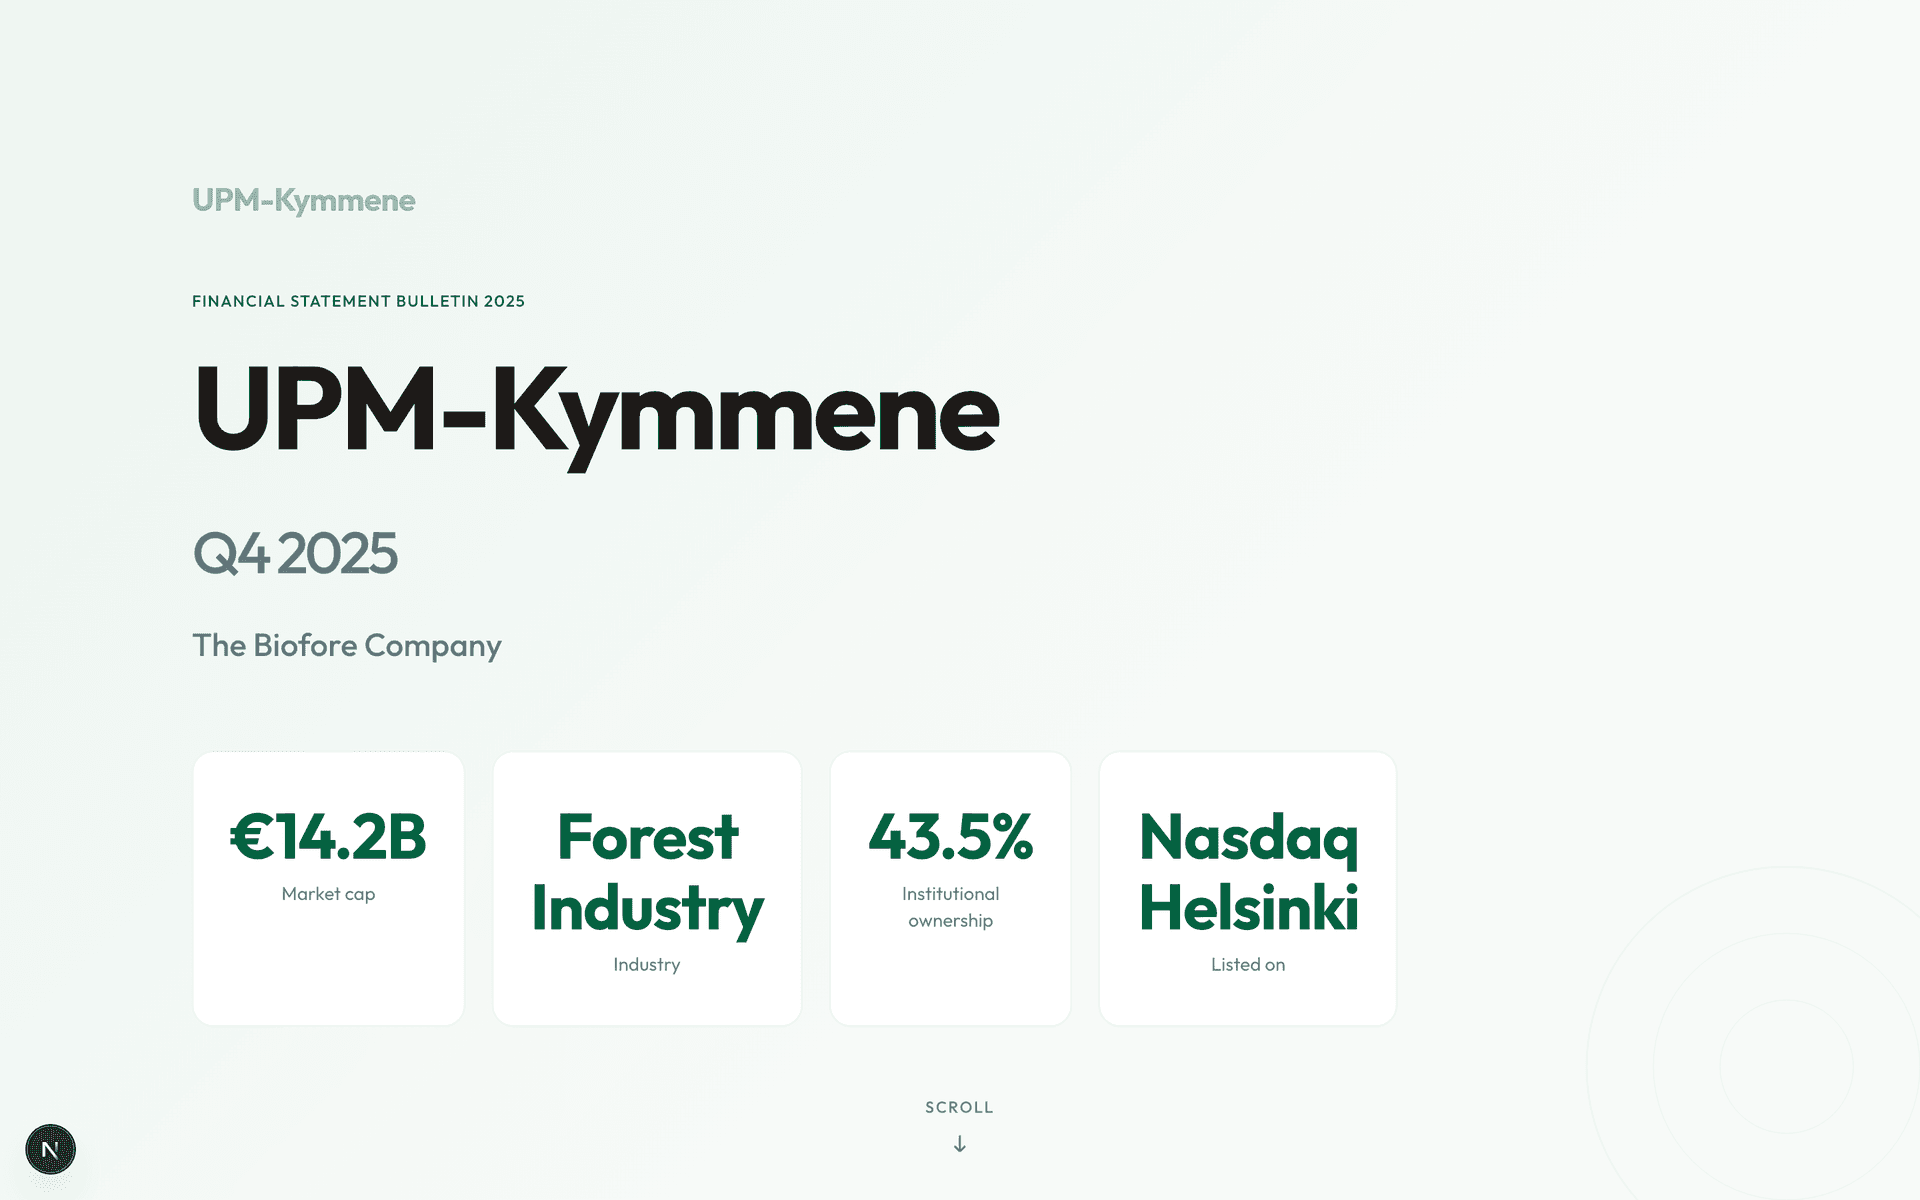
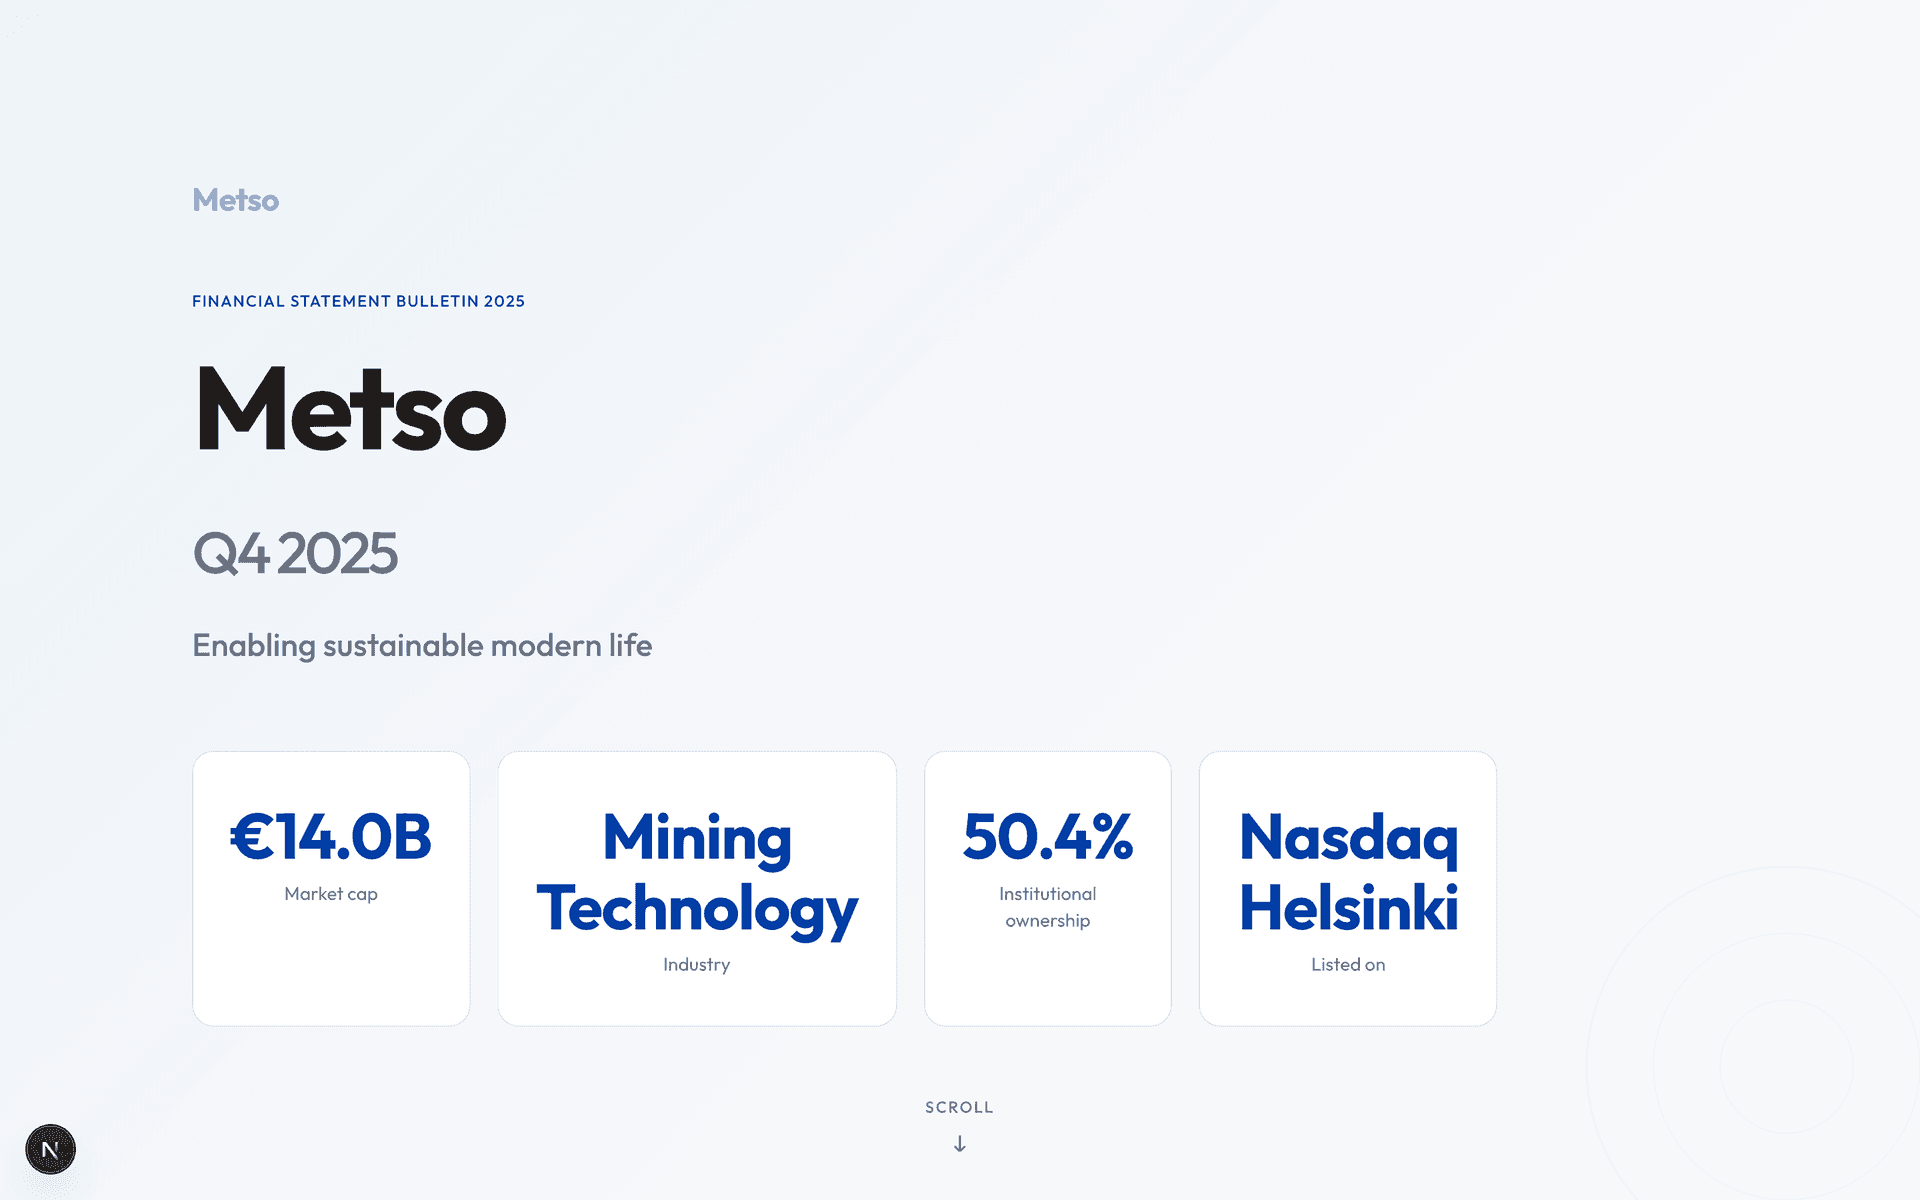
Built for Finland's largest listed companies
10 interactive reports across Nasdaq Helsinki
The outcomes
We turn reporting from a cost center into a strategic asset.
Institutional ownership across portfolio
Valuation
Clarity Drives Capital
A clear equity story reduces investor friction and justifies premium valuation multiples.
Trust
Transparency Reduces Risk
Digital-first disclosures signal governance quality and reduce perceived risk for institutional investors.
Efficiency
Streamlined Workflows
Integrated reporting reduces internal burden across finance, communications, and sustainability teams.
Ready to Lead?
The first step to clarity is a conversation.